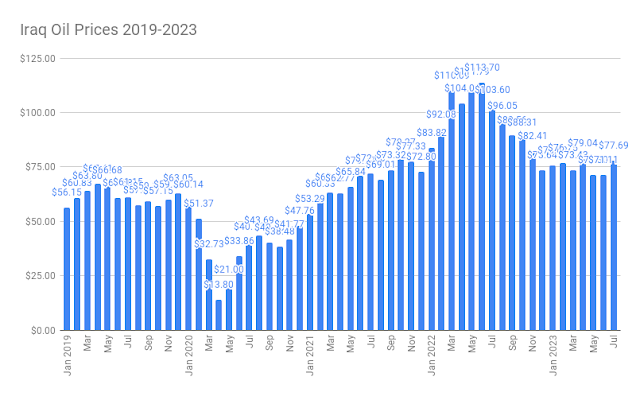
Iraq benefited from a jump in oil prices in July. That led to the highest petroleum revenue of the year.
In July Iraq exported an average of 3.444 million barrels a day. That was the highest amount since November 2019. This was impressive because the Turkish pipeline continues to be closed denying Iraq sales from its Kirkuk fields along with Kurdistan.
The price for Iraqi crude also increased from $71.11 per barrel in June to $77.69 in July. Only April had a higher mark at $79.04. At the same time prices have hovered around $70 since December 2022 which is lower than 2022’s average of $95 per barrel.
Together the added exports and prices led to a large jump in revenue for the month. Iraq earned $8.293 billion in July. That was the most since $9.258 billion in October 2022.
This was all good news for Iraq which is the most oil dependent country in the world. It is adapting to the situation with Turkey by pumping more oil out of the south. The cash is much needed to fund the bloated budget which was just passed. At the same time it highlights the fact that the country’s only growth plan is to make it even more reliant upon petroleum. That means when the market crashes like it did in 2020 Iraq will be thrown into financial crisis only to repeat the same mistakes when the oil business recovers. The Iraqi elite only thinks about the rises in petroleum and never plans for the inevitable drop.
Federal Oil Exports, Prices, Revenues 2020-2022
|
Month |
Avg Export (Mil) |
Avg Price |
Earnings (Bil) |
|
Jan 2020 |
3.306 |
$60.14 |
$6.163 |
|
Feb |
3.391 |
$51.37 |
$5.053 |
|
Mar |
3.391 |
$32.73 |
$2.962 |
|
Apr |
3.438 |
$13.80 |
$1.51 |
|
May |
3.212 |
$21.00 |
$2.136 |
|
Jun |
2.816 |
$33.86 |
$2.871 |
|
Jul |
2.763 |
$40.70 |
$3.492 |
|
Aug |
2.597 |
$43.69 |
$3.492 |
|
Sep |
2.613 |
$40.40 |
$3.173 |
|
Oct |
2.876 |
$38.48 |
$3.457 |
|
Nov |
2.709 |
$41.77 |
$3.404 |
|
Dec |
2.846 |
$47.76 |
$4.235 |
|
2020 Avg |
2.996 |
$38.80 |
$3.493 |
|
Jan 2021 |
2.868 |
$53.29 |
$4.765 |
|
Feb |
2.96 |
$60.33 |
$5.013 |
|
Mar |
2.946 |
$63.32 |
$5.787 |
|
Apr |
2.947 |
$62.77 |
$5.549 |
|
May |
2.899 |
$65.84 |
$5.917 |
|
Jun |
2.892 |
$70.77 |
$6.143 |
|
Jul |
2.918 |
$72.00 |
$6.476 |
|
Aug |
3.054 |
$69.01 |
$6.553 |
|
Sep |
3.081 |
$73.32 |
$6.777 |
|
Oct |
3.12 |
$79.27 |
$7.666 |
|
Nov |
3.272 |
$77.33 |
$7.611 |
|
Dec |
3.277 |
$72.80 |
$7.391 |
|
2021 Avg |
3.019 |
$68.33 |
$6.303 |
|
Jan 2022 |
3.203 |
$83.82 |
$8.323 |
|
Feb |
3.314 |
$92.08 |
$8.544 |
|
Mar |
3.244 |
$110.09 |
$10.913 |
|
Apr |
3.38 |
$104.09 |
$10.554 |
|
May |
3.3 |
$111.79 |
$11.44 |
|
Jun |
3.373 |
$113.70 |
$11.505 |
|
Jul |
3.303 |
$103.60 |
$10.608 |
|
Aug |
3.286 |
$96.05 |
$9.784 |
|
Sep |
3.292 |
$89.56 |
$8.845 |
|
Oct |
3.382 |
$88.31 |
$9.258 |
|
Nov |
3.329 |
$82.41 |
$8.23 |
|
Dec |
3.332 |
$73.64 |
$7.709 |
|
2022 Avg |
3.311 |
$95.76 |
$9.63 |
|
Jan |
3.266 |
$75.69 |
$7.663 |
|
Feb |
3.184 |
$76.75 |
$7.081 |
|
Mar |
3.255 |
$73.43 |
$7.26 |
|
Apr |
3.288 |
$79.04 |
$7.699 |
|
May |
3.305 |
$71.49 |
$7.306 |
|
Jun |
3.335 |
$71.11 |
$7.115 |
|
Jul |
3.444 |
$77.69 |
$8.293 |
|
2023 Avg |
3.296 |
$75.02 |
$7.488 |
SOURCES
NINA, “Ministry Of Oil: July Revenues Exceeded $8 Billion,” 8/2/23


No comments:
Post a Comment